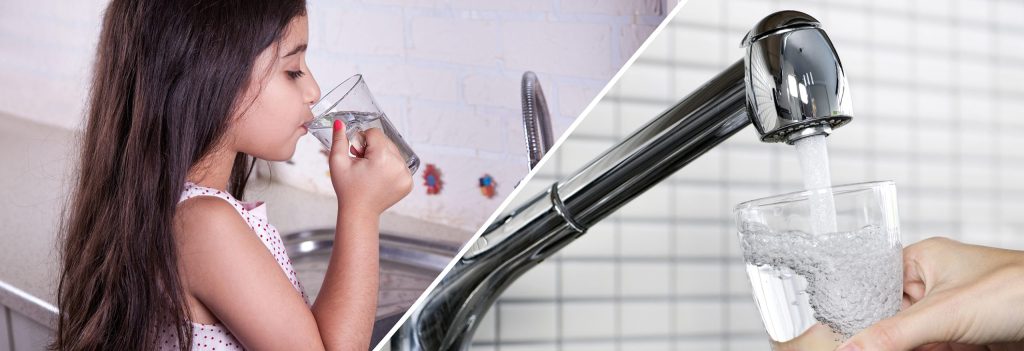
Fluoride is a naturally occurring mineral found in lakes, rivers, and groundwater. It is commonly known for its dental benefits, helping to strengthen tooth enamel and prevent tooth decay. Fluoride is commonly added to toothpaste and mouth rinses, and it is also often added to public water supplies to support oral health.
Water fluoridation is the process of adjusting the fluoride concentration in drinking water to the level recommended by public health experts for optimal dental health.
Maintaining Safe Fluoride Levels
Drinking water in the Otay Water District’s service area contains fluoride. The District does not add it directly, but purchases all treated drinking water from wholesalers who supplement the natural fluoride to reach approximately 0.8 parts per million (ppm) — the level recommended by public health experts for optimal dental health. This level is well below the limits set by the California State Water Resources Control Board’s Division of Drinking Water (DDW) to protect public health.
Customers who prefer not to drink fluoridated water can use in-home water filters, some of which remove fluoride.
Please refer to the table below for monthly fluoride measurements across the District’s service area.
California Fluoridation
In 1995, California Assembly Bill 733 authorized the California Department of Health Services to require water suppliers with 10,000 or more service connections to fluoridate their public water supply. The rules were added to the California Code of Regulations (CCR), Title 22, Sections 64433-64434, in April 1998.
Some fluoride is already naturally present in San Diego County’s water supply, which mainly comes from the Colorado River or Sierra snowpack. As water travels across the earth’s surface, it picks up fluoride through natural erosion. Fluoride levels in untreated water are approximately 0.2 ppm, ranging from 0.1 to 0.4 ppm. Since January 2011, fluoride levels in the regional distribution network have consistently ranged between 0.6 to 0.9 ppm.
Customers taking or considering fluoride supplements are encouraged to consult their medical or dental health care providers.
For more information about fluoridation, visit the links listed below the fluoride table.
Otay Water District Fluoride Levels(in parts per million) |
||||||||||||
2025 |
Jan |
Feb |
Mar |
Apr |
May |
June |
July |
Aug |
Sept |
Oct |
Nov |
Dec |
Spring Valley, La Presa, Rancho Del Rey, Bonita Long Canyon, Terra Nova |
0.6 | 0.7 | 0.8 | 0.9 | 0.8 | 0.7 | 0.7 | 0.8 | 0.8 | 0.6 | 0.6 | 0.6 |
Ranch San Diego, Jamul |
0.7 | 0.7 | 0.7 | 0.7 | 0.8 | 0.7 | 0.8 | 0.7 | 0.8 | 0.6 | 0.6 | 0.6 |
East Chula Vista |
0.7 | 0.7 | 0.7 | 0.8 | 0.8 | 0.7 | 0.7 | 0.7 | 0.7 | 0.5 | 0.6 | 0.6 |
Otay Mesa |
0.7 | 0.6 | 0.7 | 0.8 | 0.7 | 0.7 | 0.7 | 0.7 | 0.7 | 0.5 | 0.6 | 0.6 |
Otay Water District Fluoride Levels(in parts per million) |
||||
2025 |
SpringValley,La Presa,RanchoDel Rey,BonitaLongCanyon,Terra Nova |
RanchoSanDiego,Jamul |
EastChulaVista |
OtayMesa |
Jan |
0.6 | 0.7 | 0.7 | 0.7 |
Feb |
0.7 | 0.7 | 0.7 | 0.6 |
Mar |
0.8 | 0.7 | 0.7 | 0.7 |
Apr |
0.9 | 0.7 | 0.8 | 0.8 |
May |
0.8 | 0.8 | 0.8 | 0.7 |
June |
0.7 | 0.7 | 0.7 | 0.7 |
July |
0.7 | 0.8 | 0.7 | 0.7 |
Aug |
0.8 | 0.7 | 0.7 | 0.7 |
Sept |
0.8 | 0.8 | 0.7 | 0.7 |
Oct |
0.6 | 0.6 | 0.5 | 0.5 |
Nov |
0.6 | 0.6 | 0.6 | 0.6 |
Dec |
0.6 | 0.6 | 0.6 | 0.6 |
Resources
- American Dental Association – Fluoridation Facts
- American Dental Association – Fluoridation in Water
- Center for Disease Control and Prevention – Community Water Fluoridation
- Metropolitan Water District of Southern California – Fluoridation Fact Sheet
- Metropolitan Water District of Southern California – Fluoridation Frequently Asked Questions
- San Diego County Water Authority – The Fluoridation of Drinking Water
- Your state legislators may offer additional guidance on CA’s law mandating fluoridation


